How to use graphs in alight motion
In this article, we will explore the graph functions in Alight Motion, focusing on the X-axis representing the object’s speed and the Y-axis representing its movement. With a clear explanation of how to interpret the graph, you can control your objects’ motion more effectively.
Alight Motion Graphs: An Overview
What is graphic editor or alight Motion Graphs?
It is a tool which lets you to control the speed of animation.
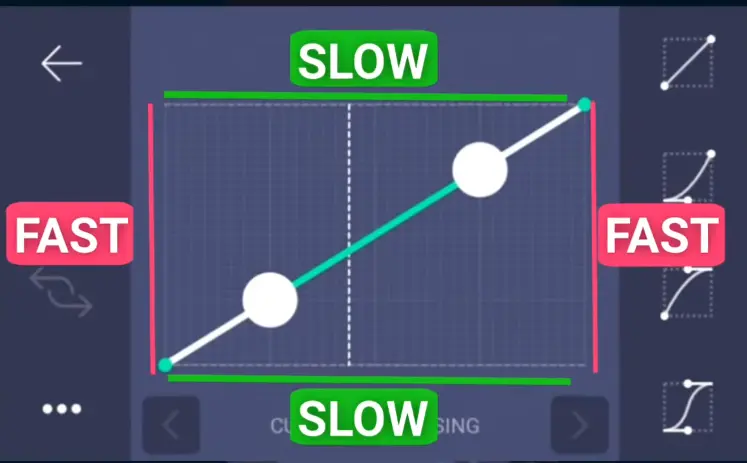
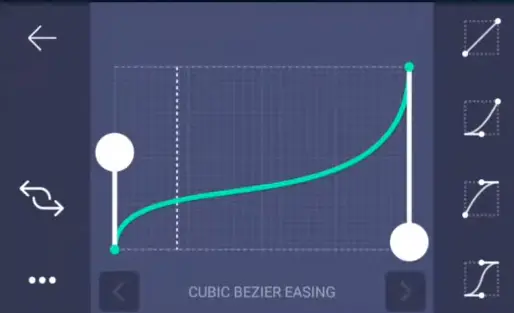
Alight Motion graphics have two axes.
- X-axis (Horizontal)
- Y-axis (Vertical)
X-axis shows how the object is slow, & Y-axis shows how fast it is moving.
Now when you drag down on Y-axis, it means your abject will move faster & vice versa.
Now let’s discuss this through images in a more practical way.
What are the 4 steps to using Alight Motion graphs?
- Step#01. Open project, add objects like photos etc. & click on the left side + Icon to add to animation.
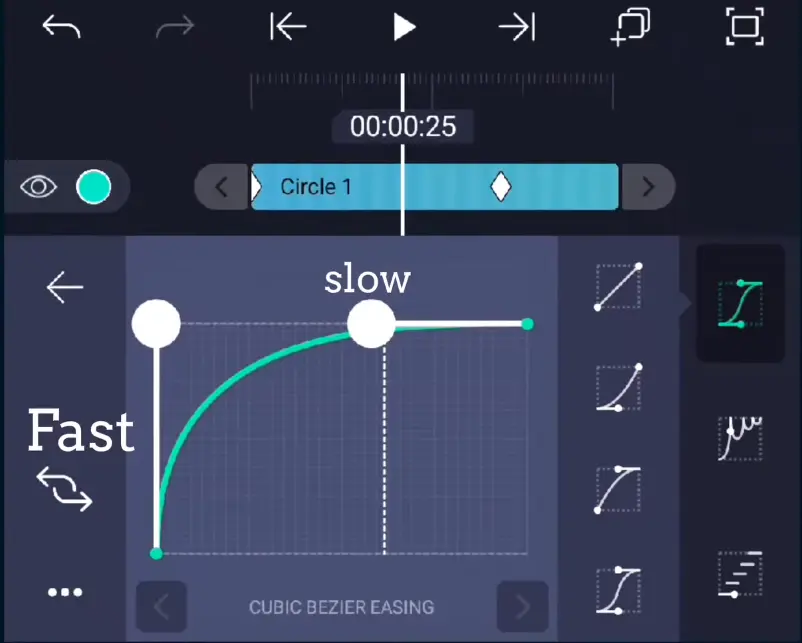
- Step #02. Now click on the graph icon on the left side.
- Step #03. Now check the graph that X-axis & Y-axis that the object will move faster or slower.
- Step #04. At last change the object’s speed by moving the graph above or below.
Alight Motion uses graphs to understand and control animations effectively. These graphical representations of keyframe animations provide valuable insights into how properties evolve over time in a video or animation project. By visualizing changes in attributes like position, scale, opacity, and rotation, users can precisely adjust animation curves and achieve seamless transitions.
Notably, users can fine-tune movements by manipulating keyframes, and adjustments in the X and Y-axis positions enable users to create dynamic visual effects, adding depth and movement to their creations. Mastering graphs in Alight Motion empowers users to craft compelling and polished animations that captivate audiences and convey their creative vision with finesse.
What are the 2 main benefits of using Alight Motion Graphs?
Using Alight Motion graphs offers two main reasons that make them essential tools for video editors and animators:
01. Precise animation control:
Alight Motion graphs allow users to have precise control over keyframe animations. By visually representing the changes in properties over time, users can fine-tune the animation curves, adjust with ease, and manipulate keyframes with ease. This level of control ensures that the movements and transitions in the video or animation are smooth, seamless, and precisely aligned with the creative vision. For adding transitions in Alight Motion, users can utilize keyframes to control the animation’s timing and adjust properties like opacity and position, creating seamless and visually appealing transitions between scenes or elements.
02. Customizable and dynamic effects:
Another significant reason for using Alight Motion graphs is the ability to create customizable and dynamic visual effects. By adjusting animation curves and manipulating keyframes, users can add depth and complexity to their animations, making them more engaging and visually appealing. Whether it’s adding a burst of light, creating intricate motion paths, or applying various transformations, Alight Motion graphs empower users to unleash their creativity and bring unique effects to their videos. This customization ensures that each animation is tailored to suit the project’s specific requirements, resulting in captivating content that stands out from the rest.
Summary
Alight Motion graphs offer precise animation control and the ability to create customizable and dynamic effects, making them indispensable tools for achieving professional-quality animations and videos. These graphs empower users to express their creativity, enhance storytelling, and deliver visually impressive content that captivates audiences.
Check also: How to mask on alight motion